Using the Resource Gantt Chart – Web Client
If you are running the Resource Gantt Chart on a Web client, follow
these steps to specify which resources you want to analyze, and to change
your display options.
Selecting Resources to Display
When you open this form, the Select Gantt Data dialog box is
displayed.
- To display all resources, select All
Resources.
To select a specific resource list to display, clear the All
Resources check box to enable the Selection Name field.
Select a resource list.
To create a new list of resources that will be included in the Selection Name field:
- Click Selections to
display the Resource Gantt Chart
Selections form.
- Click the New button in the tool bar.
- Specify a name for your new selection.
- In the Resources grid, click and select a resource to include
in your list. Specify a sequence number for it.
- To add more resources, click the New button in the tool bar.
Use the Up and Down
buttons to move the resources up and down in the list.
- When all the resources you want to display are added to the
list, save your changes and close the form.
- In the Select Gantt Data
form, select your new list in the Selection
Name field.
- In the Alternative field,
accept the default of zero to work with the production data, or select
an alternative plan number.
- In the Start Date and End Date fields, define the
date range for which chart data is loaded. The planning or scheduling
horizon dates are used as the defaults.
- Click OK to populate the
Gantt Chart with the selected data.
To edit an existing list in the Select
Data dialog box, select the list, click Edit
and follow the steps above. To delete a list, select it and click Delete.
To change the list of displayed resources in the Resource
Gantt Chart at any time, click the Select
Data icon in the top left corner of the chart.
Changing Display Options
To change display options, click the Options icon in the
top left corner of the chart. You can change these options:
- Secondary Selection: Use this
option to indicate the type of logic used when you select a particular
bar in the display.
- None (the default value)
shows only the selected utilization bar in yellow.
- Same Operation shows all
operations working on the same load. This option is useful if
the operation is interrupted due to a shift change and the load
is reallocated to another resource. All utilization bars for this
operation/load are shown in yellow.
- Same Job shows all utilization
bars for the same demand (job, production schedule, MPS order,
planned order, etc.) in yellow.
- Bar Text: Use this option to
change the text that is displayed on the utilization bars. By default,
the job number displays on the bar. You can display the operation
number, the item number, or no text.
To change the time scale of the chart, use the Zoom In and Zoom Out
icons in the top left corner of the chart.
Highlighting Bars in the Chart
You can use highlighting to color all chart bars that meet specified
criteria. For example, you can color red all bars associated with late
orders or color blue all bars for a large order quantity.
To apply an existing highlight to the chart, click the Edit Highlights
icon in the top left corner of the chart, and select the highlight name.
To create and apply a new highlight:
- Click the Edit Highlights icon in the top left corner of the chart
and select Edit. The Gantt Highlights form displays.
- Click the New button in the tool bar to add a highlight.
- Specify the highlight name.
- Click in the grid to add a criterion (rule) for applying color
to a bar. A criterion consists of: sequence, type, comparison operator,
value, and optional substring comparison settings.
Criteria are rules associated with a highlight on the Resource
Gantt Chart. You can add multiple criteria to a highlight. Therefore,
for the graphical bar to be colored according to the highlight, the
resource must meet the highlight's various criteria.
Complete these fields (click each link for more information):
- Select Must meet all criteria
if all the listed criteria must be met in order for a bar to be highlighted
in the chart. If this field is not selected, only one or more criteria
in the list must be satisfied.
- Click the color box to display the standard color dialog box, where
you can select a color. This color is used as the highlight color
for a bar that meets the specified criteria.
- Use the Up and Down
buttons to change the sequence of the criteria.
- Save your changes and close the form to return to the Resource
Gantt Chart form.
- To apply your new highlight, select the name of your highlight
from the Highlight right-click menu option.
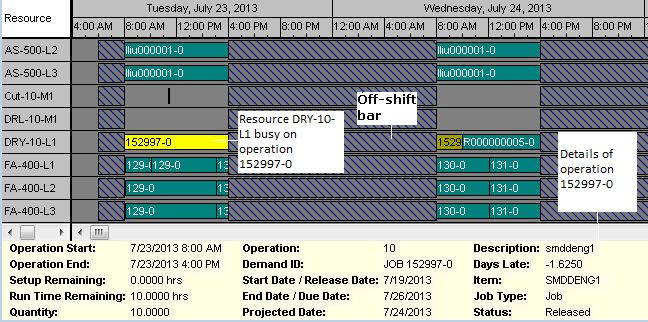
Analyzing the Displayed Data
The Gantt chart display consists of one row for each resource named
in the selection. The display is organized as follows:
- Green bars represent periods of utilization for the resource shown
in the left column.
- Red bars represent down time (for example, off-shift periods or
shift-exceptions).
- When you select a bar, the color changes to yellow.
- Blank areas of a row represent idle time for the resource.
NOTE: When the Gantt
chart displays load for infinite resources, the load bars might display
stacked on top of one another. As a result, some of them may not be visible.
Click on a resource utilization bar to view details about the operation
the resource is performing and the demand it is working on during the
time period. Click on a downtime bar to view details about the reason
for and duration of the downtime.
The picture below illustrates three resources, each working on a single
operation in a routing.
Manually Adjusting Gantt Chart Data
The Resource Gantt Chart - Scheduler form allows direct manipulation
of the bars shown in the Gantt chart. Available adjustments are:
- Changes to the start and/or end of an operation
- Moving an operation to a different resource
- Freezing a job or operation.
When you move a bar in the chart, the Gantt
Edit Operation form is displayed. The "from" resource,
start date, and end date indicate the original information from the chart.
Specify new values for these fields:
- To Resource is the resource
where you want to move the operation.
- To Start Date is the new
start date of the operation
- To End Date is the new
end date of the operation.
Click OK to complete the edit
of the operation and return to the chart. The bar on the chart is updated.
Manual adjustments are available whether the schedule is created by
a normal Scheduler run or through the Use
Planning Output for Scheduling planning parameter. Once manual schedule
adjustments are made through the Gantt Chart, the results are reflected
in all Scheduling analysis forms and reports available to the user, including:
- Resource/Resource Group Load Profile - Scheduler
- Resource/Resource Group Utilization - Scheduler
- Resource/Resource Group Schedule
- Resource/Resource Group Summary Report
Related Topics
Resources
Overview